
Quick Answer: Excel is a spreadsheet program you use to store numbers and text in a grid, then let the program do the math for you. I use it to track budgets, build lists, run calculations with formulas, and turn plain numbers into charts I can actually understand at a glance.
In this step-by-step post, I am going to walk you through one real example so you can see exactly what Excel does and why so many people rely on it every day.
By the end of this post, you will know how to enter data into Excel, do math automatically with a formula, total up a column, spot a problem at a glance, and turn your numbers into a chart.
Download the practice file before you start:
A Little History First
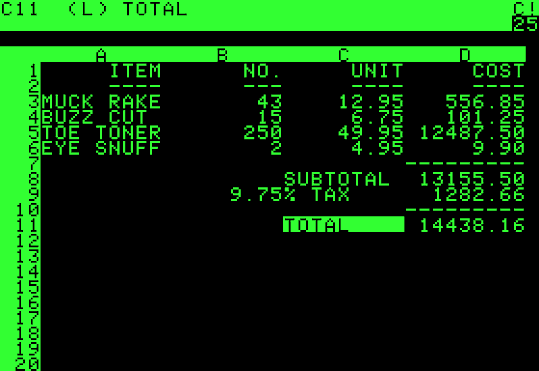
Excel is not the first spreadsheet program, and it did not invent the idea of rows, columns, and formulas. That credit goes to VisiCalc, released in 1979, which showed the world that a computer could replace a paper ledger.
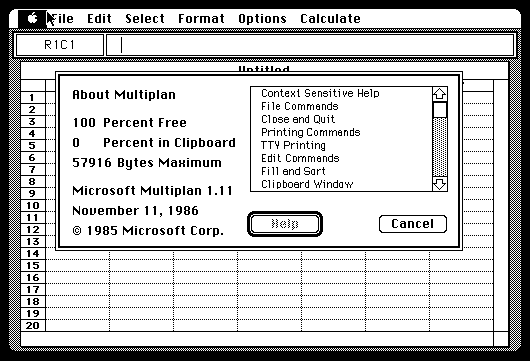
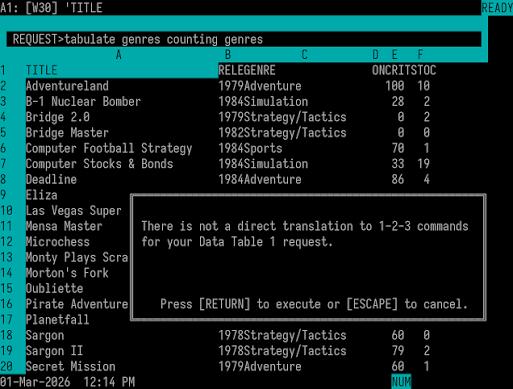
Microsoft’s own first attempt was a program called Multiplan in 1982, but it lost ground to a competitor called Lotus 1-2-3.
Multiplan:
Lotus 1-2-3:
Microsoft released the first version of Excel for the Mac in 1985, then brought it to Windows in 1987. Excel’s big advantage was its interface. You could click and drag with a mouse instead of memorizing text commands, which felt far more natural. By the early 1990s, Excel had overtaken Lotus 1-2-3 to become the leading spreadsheet program, and it has held that position ever since, now as part of Microsoft 365.
A quick note on versions: Everything I show you in this post works in Excel 2016 and later, Excel for Microsoft 365, Excel for Mac, and Excel for the web (the free browser version).
What You’ll Need
- A blank workbook, or my sample file
- A few minutes and some numbers. I’ll use a simple monthly budget as my example, but you can follow along with your own numbers instead.
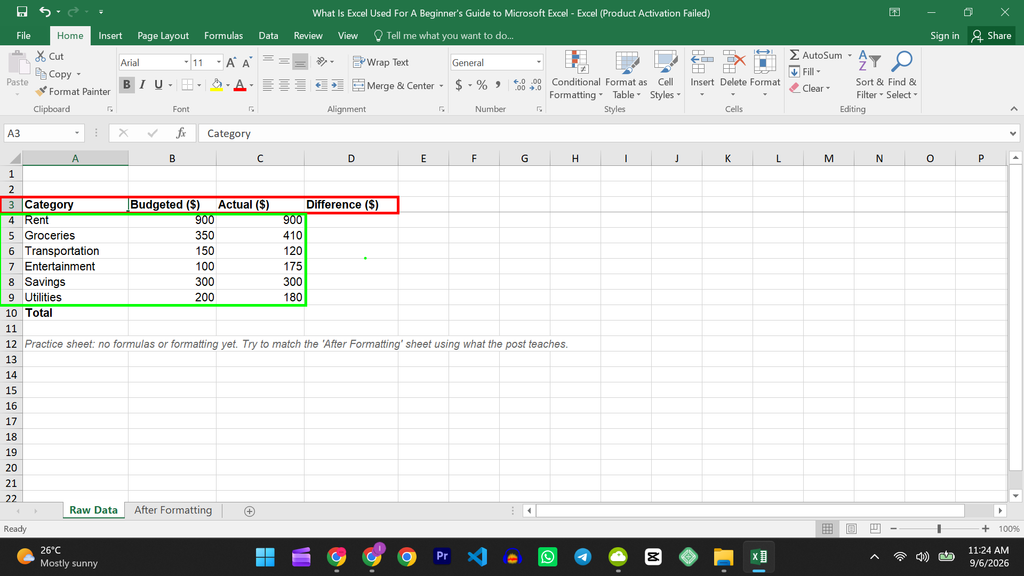
To make this concrete, I built one real sample file, a small monthly budget tracker, and I’ll use it for every example below. The “Raw Data” sheet has the same six categories, budgeted amounts, and actual amounts you see below, but no formulas and no formatting yet, so you can type along and build everything yourself. The “After Formatting” sheet shows exactly what your sheet should look like once you’re done with all five steps. A “range” just means a group of cells, like A1 to A10. In my sheet, my data sits in the range A3:D10.
So, What Is Excel Used For? Five Things You Can Do Right Now
Step 1: Start From Your Data
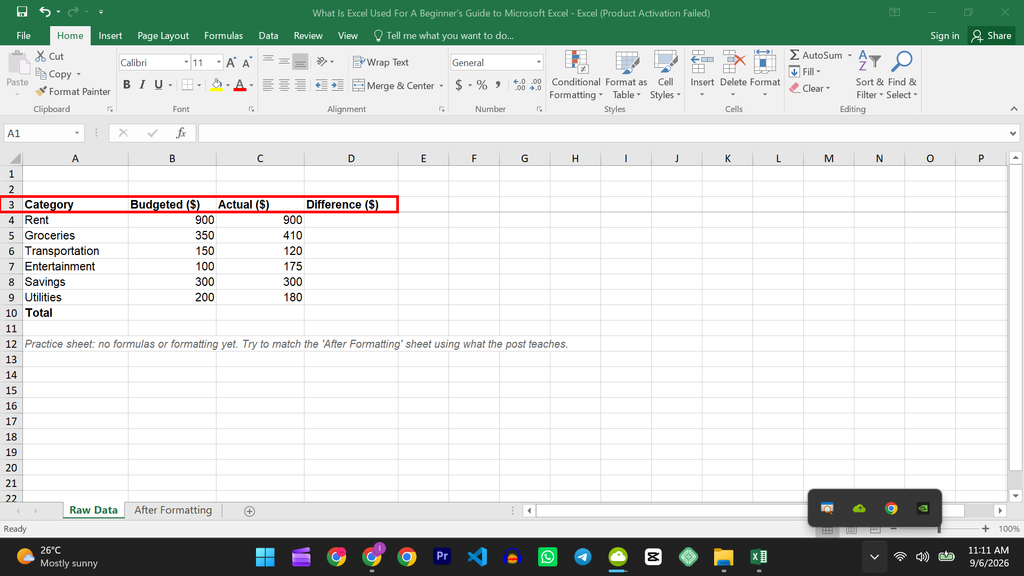
What to do: Open the “Raw Data” sheet in my sample file, or open a blank workbook and type a header in row 1 for each piece of information you want to track. In my sheet, my headers are Category, Budgeted ($), Actual ($), and Difference ($).
Then I type one row of data per item underneath, starting in row 4: Rent, Groceries, Transportation, Entertainment, Savings, and Utilities, each with a budgeted amount and an actual amount. If you’re using my sample file, this part is already done for you on “Raw Data”, so you can jump straight into Step 2.
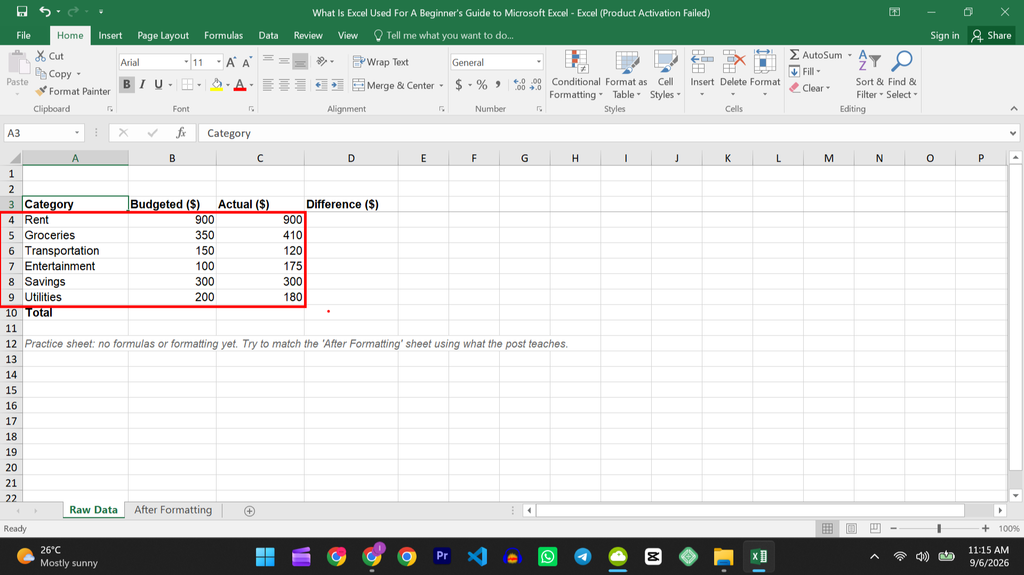
Why I’m having you do it this way: Excel organizes everything into cells, which are just the little boxes formed where a column and a row meet. Cell A4 holds “Rent,” cell B4 holds “900.” Once your data lives in its own cell, Excel can find it, sort it, and calculate with it. That’s the whole idea behind a spreadsheet.
What you should see: A clean table with one header row and one row per item, no blank rows in between.
Common mistake: Leaving a blank row or column inside your data. Excel treats that blank row as the end of your table, which throws off totals and sorting later.
Step 2: Let Excel Do the Math With a Formula
What to do: Click cell D4, type =B4-C4, and press Enter. This subtracts my actual spending from my budgeted amount. A “formula” is just an instruction that starts with an equals sign and tells Excel to calculate something instead of you doing it by hand.
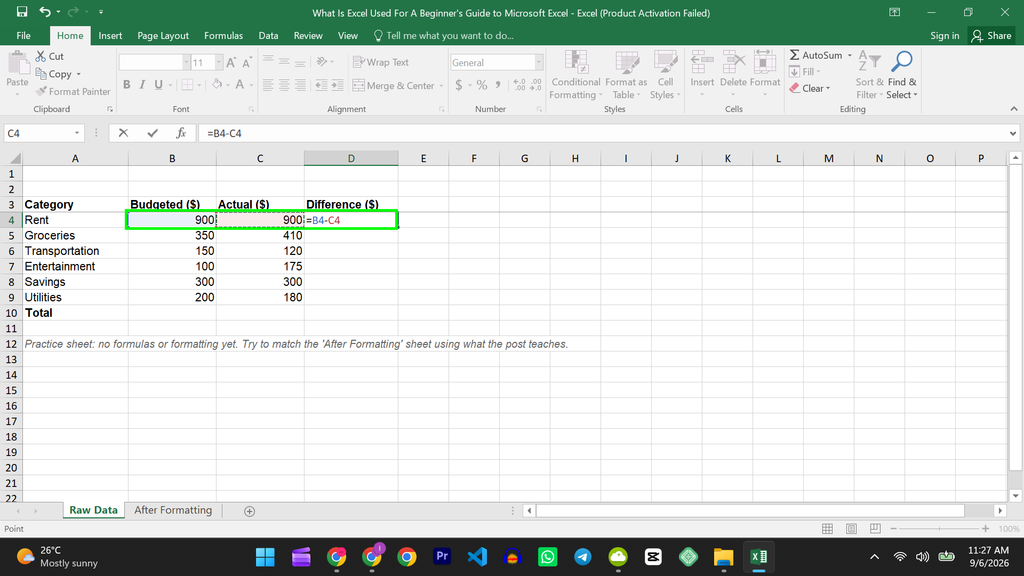
Why I’m having you do it this way: This is the single biggest reason people use Excel instead of a notebook or a calculator. Once the formula is in D4, you can copy it down to D9, and every row updates itself using its own row’s numbers.
What you should see: In my sheet, D5 shows negative 60, because I budgeted 350 dollars for Groceries but actually spent 410. A negative number here means I went over budget. If your numbers don’t match, compare your formulas to column D on the “After Formatting” sheet.
Common mistake: Typing the numbers directly instead of the cell references, like typing =350-410. That gives you the right answer once, but it will not update if your numbers change later.
Step 3: Total Everything Up Automatically
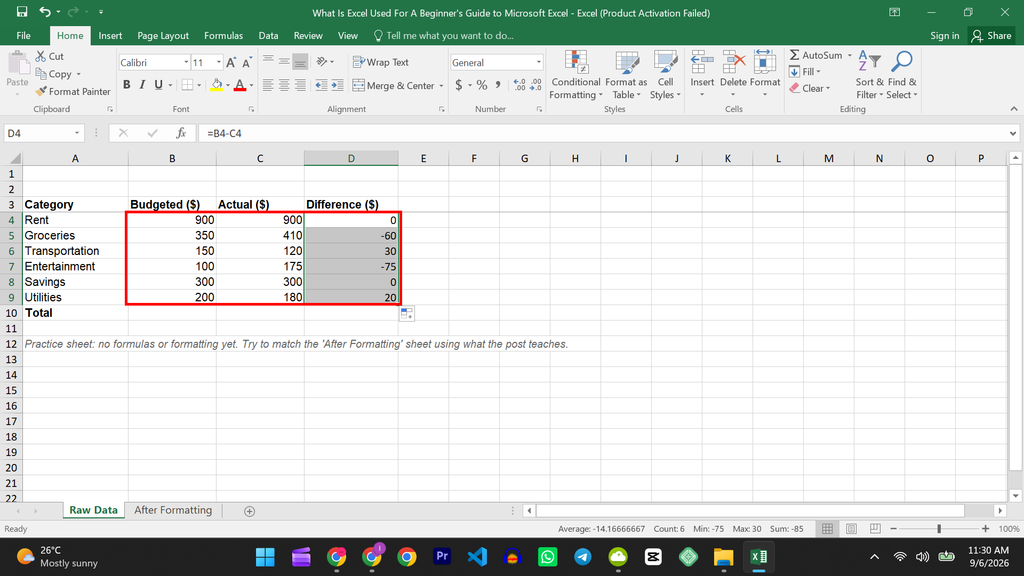
What to do: Click cell B10, type =SUM(B4:B9), and press Enter. Do the same for column C and column D. SUM just means “add up everything in this range.”
Sum for Column B:
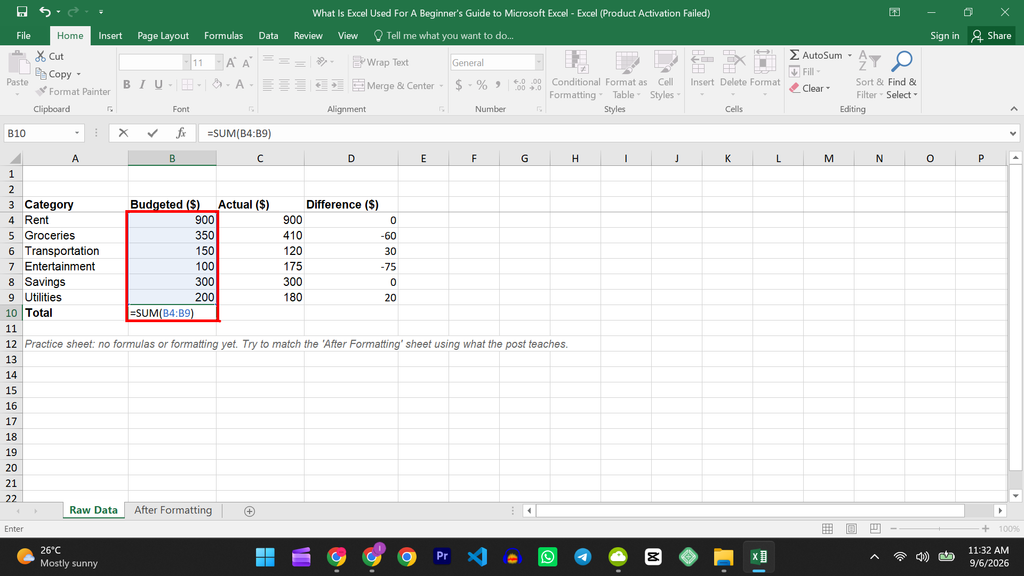
Sum for Column C:
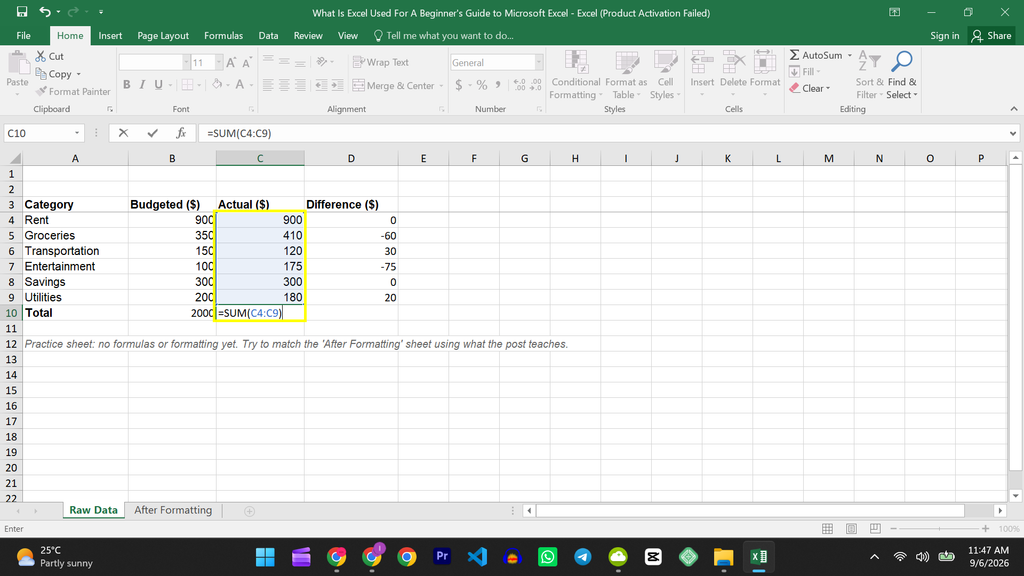
Sum for Column D:
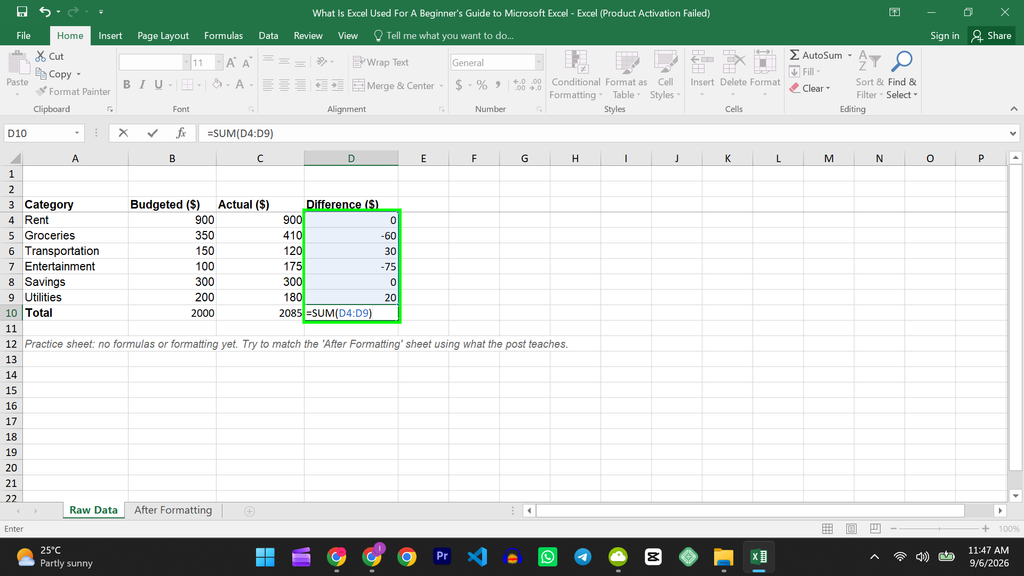
Why I’m having you do it this way: SUM is the formula I use more than any other in Excel. Instead of adding six numbers in your head or on a calculator and typing the answer, Excel adds them for you and keeps the total accurate even if a number changes later.
What you should see: My total budgeted amount comes out to 2,000 dollars, my total actual spending comes out to 2,085 dollars, and my total difference is negative 85 dollars, meaning I went 85 dollars over budget for the month overall.
Common mistake: Selecting the wrong range, like accidentally including the header row in =SUM(B3:B9). Since row 3 has text instead of a number, Excel just ignores it, but it’s worth double-checking your range matches your actual data rows.
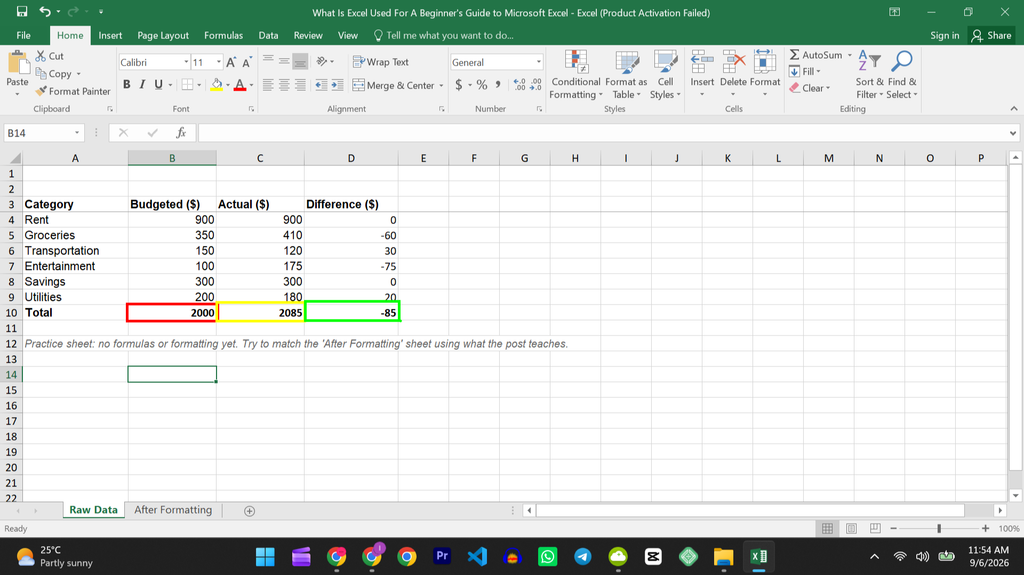
Most versions also have an AutoSum button on the Home tab that writes this formula for you automatically.
Step 4: Spot Problems at a Glance With Conditional Formatting
What to do: Select cells D4 through D9. Go to the Home tab, click Conditional Formatting, choose Highlight Cell Rules, then Less Than.
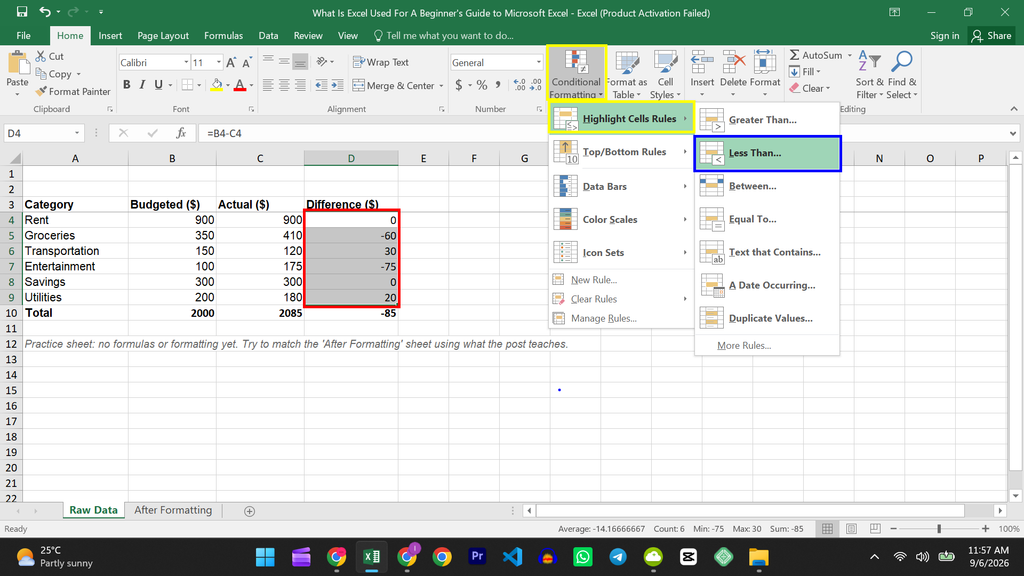
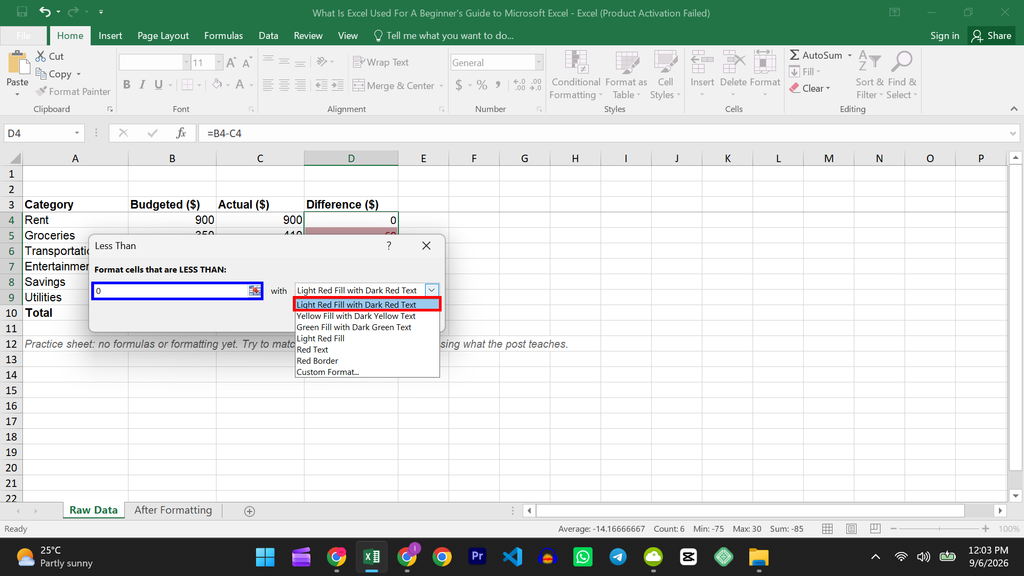
A dialog box appears, then type 0. Pick a red fill so any negative number stands out since it is only negative numbers that are less than 0. “Conditional formatting” just means Excel changes how a cell looks based on what’s inside it.
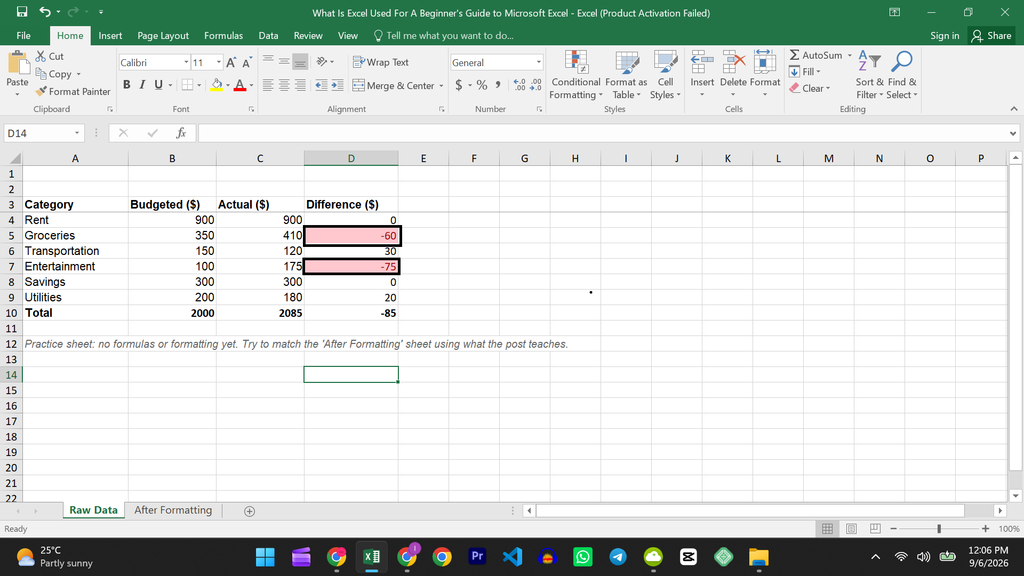
Why I’m having you do it this way: You do not need to read every single number to know something is wrong. In my sheet, Groceries at negative 60 and Entertainment at negative 75 turn red automatically, so I can see my two problem categories in half a second.
What you should see: Two of my six rows, Groceries and Entertainment, turn red because I overspent in those categories. The other four stayed unformatted because I stayed on budget or under it. Check the “After Formatting” sheet to confirm you got the same two rows.
Common mistake: Selecting the whole table, including the Category and Total columns, before applying the rule. That can end up highlighting text cells or your total row in ways you did not intend. Select only the column you actually want to test.
Step 5: Turn Your Numbers Into a Chart
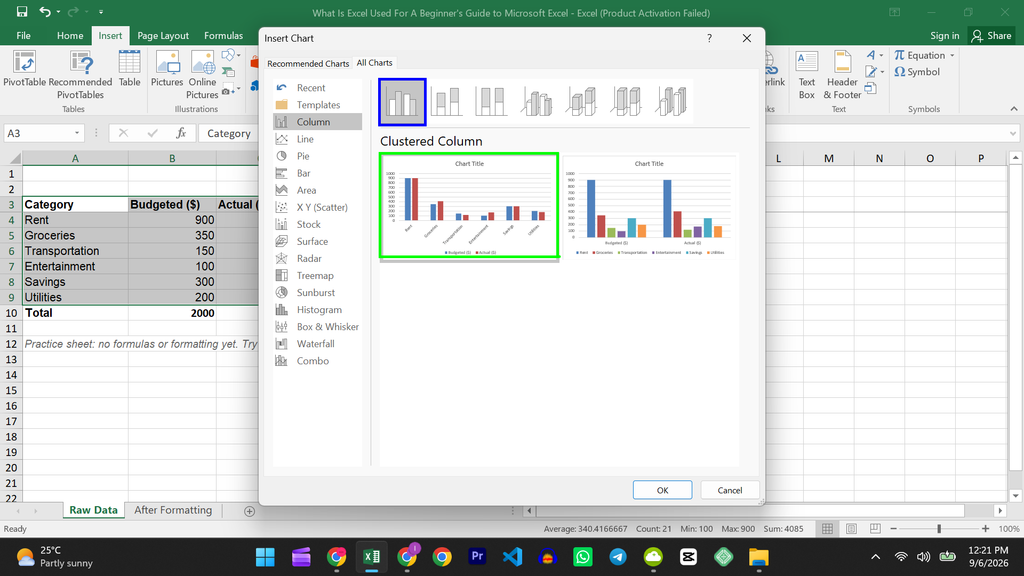
What to do: Select the range A3:C9, which includes my Category, Budgeted, and Actual columns, then go to the Insert tab, Click on Insert olumn or Bar Chart, then click on More Column Charts.
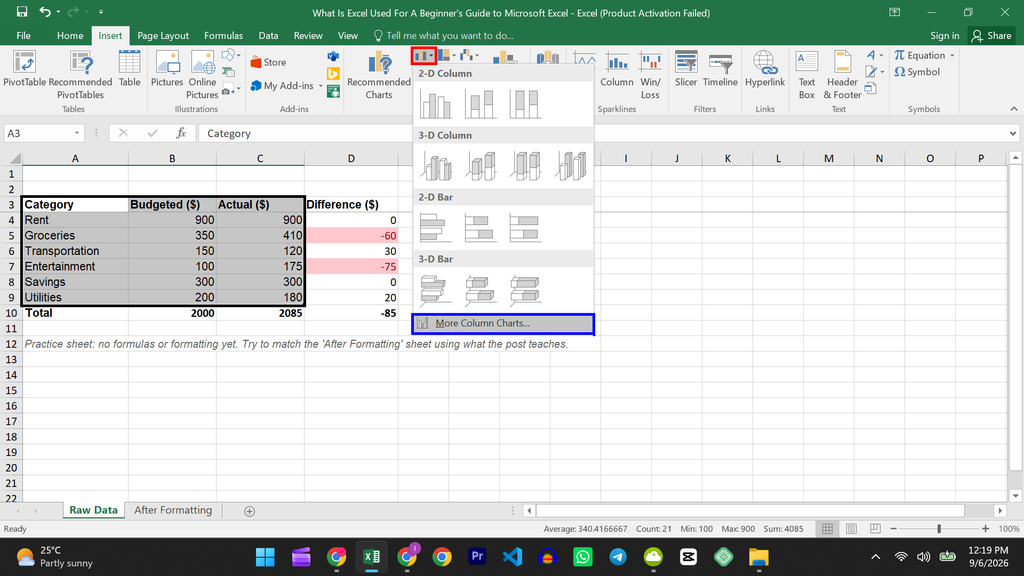
Then choose a Clustered Column chart and click OK.
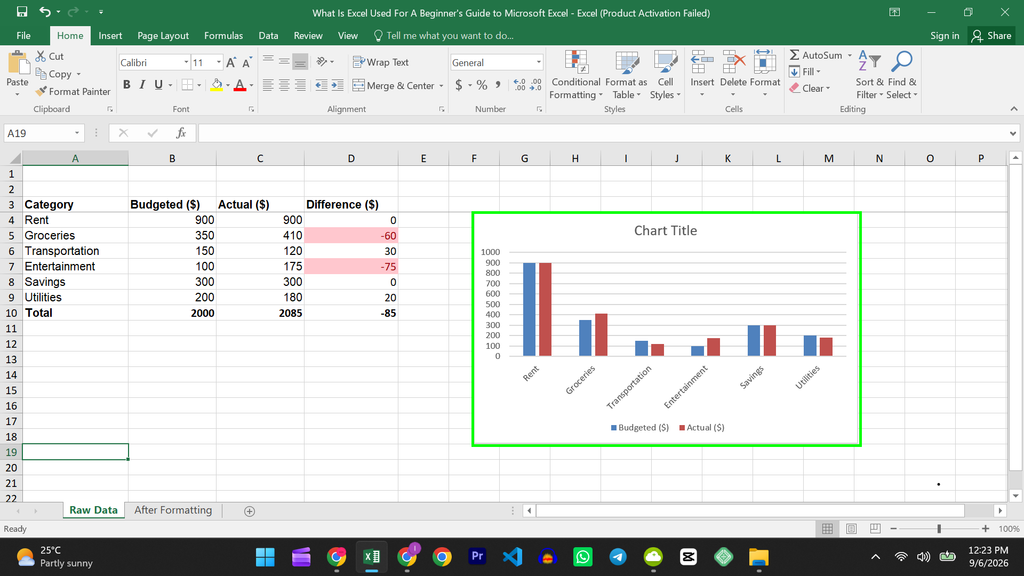
Why I’m having you do it this way: A table of numbers is accurate, but a chart is fast to understand. Seeing my Entertainment bar taller in the “actual” color than the “budgeted” color tells the same story as the negative 75 in D7, just faster.
What you should see: A bar chart with one pair of bars per category, one bar for what I budgeted and one for what I actually spent, sitting side by side. Compare it to the chart already sitting next to the data on the “After Formatting” sheet.
Common mistake: Including the Difference column in the chart selection. That adds a third bar per category that usually just clutters the picture instead of clarifying it.
Why This Works
Every cell in Excel can hold a number, some text, or a formula that points to other cells. Because a formula points to a cell instead of a fixed number, changing one input, like my actual grocery spending, automatically ripples through the difference formula, the total, the red highlight, and the chart. You build the logic once, and Excel keeps recalculating it for you from then on. That single idea, cells that talk to each other, is really what is Excel used for at its core.
A Different Way to Do It
If you do not have Excel installed, or you need to share a budget with someone else in real time, I’d use Google Sheets instead. It uses very similar formulas, so =SUM(B4:B9) works the same way there. I still reach for actual Excel when I need more advanced formulas or I’m working with a file someone else built in Excel, since some features do not translate perfectly between the two.
Common Problems and How to Fix Them
| Problem | Why It Happens | How to Fix It |
| A formula shows #REF! | You deleted a row or column that a formula was pointing to. | Undo the deletion with Ctrl+Z, then rewrite the formula referencing the correct cells. |
| SUM shows 0 even though the column has numbers | The numbers are stored as text, often shown by a small green triangle in the corner of the cell. | Select the cells, click the warning icon that appears, and choose Convert to Number. |
| Copying a formula down gives wrong results | A relative reference shifted when you copied it, pulling in the wrong row. | Check the formula bar on a few copied cells to confirm the row numbers match what you expect. |
| Conditional formatting did not apply | You selected the wrong range, or set the rule to “greater than” instead of “less than.” | Go to Conditional Formatting, then Manage Rules, and check which range and condition the rule is using. |
Tips to Avoid These Problems Next Time
- Type one blank test row above your real data first, so you can experiment with a formula before applying it to everything.
- Click a formula cell before you trust its result, and check the formula bar to confirm it references the range you meant.
- Save your file before you delete a row or column, in case a formula was quietly depending on it.
Frequently Asked Questions
Is Excel only for accountants and finance people? No. I use it for budgets, but people also use it for grocery lists, workout logs, class schedules, and small business inventory. If you can put information in rows and columns, Excel can probably help.
Do I need to know math to use Excel? No. You need to know which numbers to add or subtract, but Excel does the actual calculating once you write the formula correctly.
What is the difference between Excel and a Word document with a table in it? A Word table just displays information. An Excel cell can calculate, sort, filter, and update automatically, which a Word table cannot do.
Can I use Excel for free? Excel for the web is free with a Microsoft account and covers the basics I showed you here. The full desktop version usually requires a Microsoft 365 subscription or a one-time purchase.
What is Excel used for in an actual job? I’ve seen it used for budgets, sales tracking, inventory counts, project schedules, and simple reports, basically anywhere someone needs to track numbers and see totals or trends.
Do I have to build formulas myself, or does Excel do it automatically? Both. You write your own formulas like I did here, but Excel also offers a built-in AutoSum button and suggested formulas for common tasks like totals and averages.
Wrapping Up
You now know what Excel is used for, not just in theory but from one real spreadsheet: storing data, calculating with formulas, totaling columns, flagging problems, and charting results. That’s the core loop behind almost everything else Excel can do.
Official reference: Microsoft Excel Help & Learning (Microsoft Support)
